Sizing Your Energy System |
|
Determine The Suitability Of Your Installation Site
Answering the question of whether or not a solar or wind energy investment is right for you will first start with your location, or specifically where you can install your equipment and how suitable that location is for harnessing renewable energy. Any obstructions like buildings or tall trees standing between the energy source and the installation will have a negative affect on the performance of your system.
When installing solar panels, they should face south whenever possible if you're located in the northern hemisphere, and north if you live in the southern hemisphere, and they shouldn't be shaded from the sun by any obstructions. Depending on the configuration, one shaded panel could drag the output of the entire array down with it. With rooftop installations, shading generally isn't an issue but roof orientation can be. With ground installations it's easier to orient the panels properly, but shading can be a problem due to being at a lower level in regard to tall obstacles like trees and buildings. It's good practice to track any shadows on your property throughout the day, and bare in mind that shadow length will change from season to season as well, depending on how high the sun rises at solar noon.
When installing solar panels, they should face south whenever possible if you're located in the northern hemisphere, and north if you live in the southern hemisphere, and they shouldn't be shaded from the sun by any obstructions. Depending on the configuration, one shaded panel could drag the output of the entire array down with it. With rooftop installations, shading generally isn't an issue but roof orientation can be. With ground installations it's easier to orient the panels properly, but shading can be a problem due to being at a lower level in regard to tall obstacles like trees and buildings. It's good practice to track any shadows on your property throughout the day, and bare in mind that shadow length will change from season to season as well, depending on how high the sun rises at solar noon.
|
Sponsored by
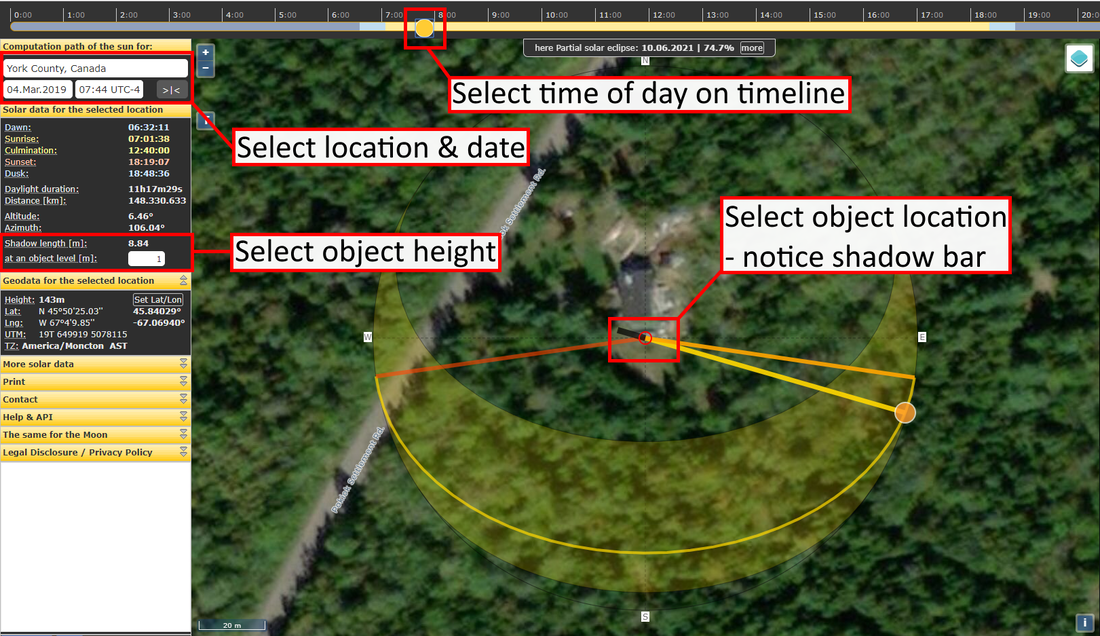
An easier method to track shadows and determine the best location for a solar array would be to use an interactive map like www.suncalc.org. Just click on your location in the map and it will plot the sun's position in the sky at any hour of any day of your choosing. If there are obstacles on your property that you're concerned will cast a shadow on your panels, then use the tools on the left of the page to select the object's height, then zoom in on your property and select it's location on the map. Use the scroll bar in the timeline at the top of the page to change the sun's position on the map. You should notice a dark bar representing the shadow of the object appear behind the marker on the map. The data on the left of the page will indicate the length of the shadow at that given time (see the image on the right).
|
When it comes to harnessing clean wind (ie not turbulent) from a particular site, tower height matters. Wind behaves a lot like water. It's strongest and less turbulent above the tree canopy than it is below it. Any obstacles in the path of a wind stream will create turbulence, slow it down, and negatively affect performance from a wind turbine. An ideal installation site would have an open area that allows a 30 meter radius around the turbine tower that's free of any obstacles that could affect the wind stream. The turbine itself should also be at least 10 meters above any trees in the area. This is just a guideline, however. As you can see from the image of my property above, I don't have a whole lot of open space. The key in that situation is going a bit higher than recommended to be sure that turbulence caused by the canopy won't interfere with the turbine. In most cases a 30-50 meter tower is plenty tall enough to put a turbine into a clean wind stream.
|
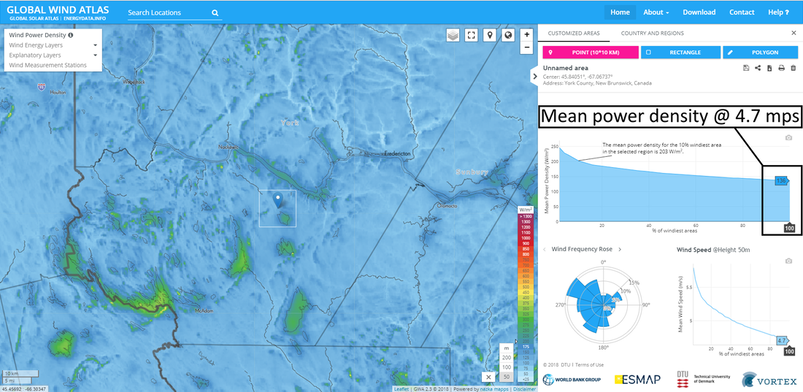
Establishing the mean annual wind speed at the required height is also important. Coupled with the condition of your installation site, this ultimately determines whether or not a turbine installation is practical for you. You can use an anemometer mounted to a makeshift pole to measure the local wind speed throughout the year, and roughly establish a mean annual wind speed. Or you can choose the easier and quicker option of referring to a wind atlas like globalwindatlas.info/. Simply click on your location in the map, select your tower height, and it will automatically generate wind data for your area, and graph the mean annual wind speed based on its frequency distribution (ie: how often the wind blows at different speeds during a period of time, see the image on the right). This tool will also help determine the size of turbine required to meet your needs, as detailed below in the 'Sizing A Wind Turbine' section.
|
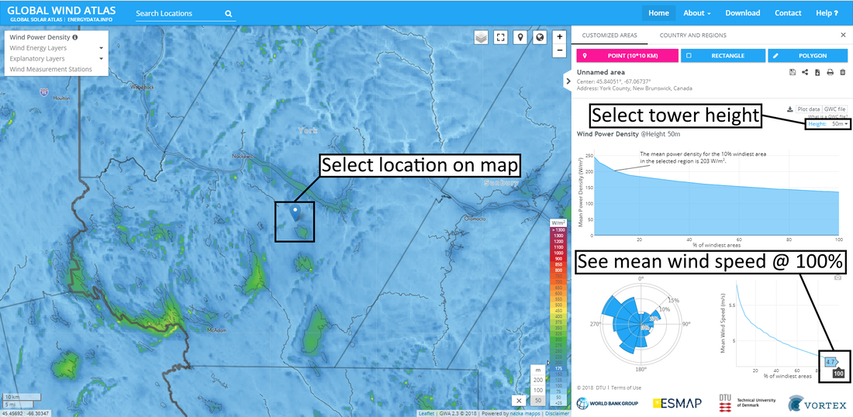
[Data/information/map obtained from the] “Global Wind Atlas 2.0, a free, web-based application developed, owned and operated by the Technical University of Denmark (DTU) in partnership with the World Bank Group, utilizing data provided by Vortex, with funding provided by the Energy Sector Management Assistance Program (ESMAP). For additional information: https://globalwindatlas.info This image is for educational purposes only, RST has no affiliation with the DTU or the World Bank Group.
|
Energy Use
What you'll need for generation equipment will depend almost entirely on your daily energy requirements, and how much of your energy that you would like to get from renewable sources. This can be determined by referring to your monthly electricity bill to find your typical monthly energy usage expressed in kWh (kilowatt hours). Then divide that number by 30 to approximate how many kWh you use each day.
|
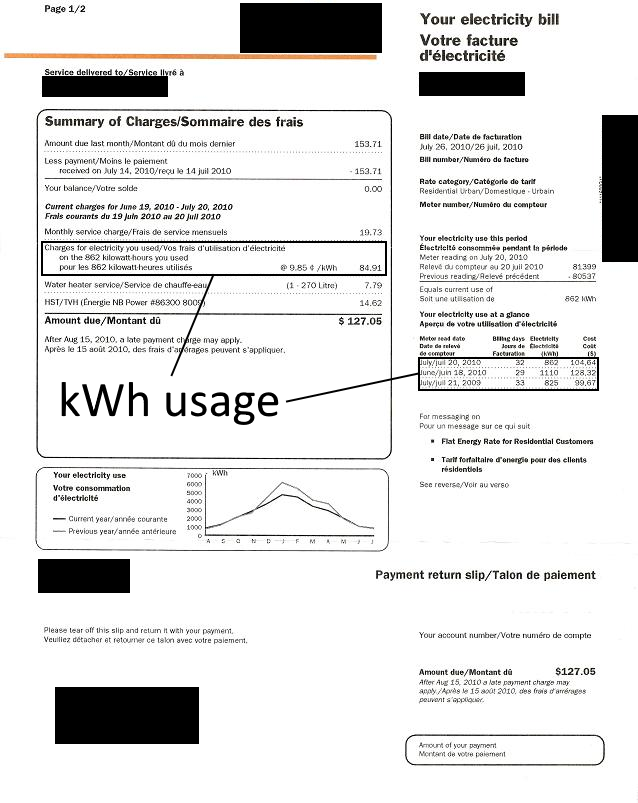
For example, notice the areas encircled on the bill to the right. The stated energy use for that month is 862 kWh. 862 / 30 days = 28.73 kWh used each day. Bare in mind that this was billed during the summer, when people generally use the least amount of energy in my region. It's always best to size your system for worst case scenario (ie winter demands). But for simplicity in the examples to follow, we'll stick to the usage stated on this bill.
If you don't have a utility bill to refer to, then you can estimate how much energy you'll need by checking the power ratings of the devices, appliances or equipment that you want to power. If you want to power a water pump for a pond, for example, and it's rated for 110 volts and 5 amps, then you will need to find the total power in watts. Volts x Amps = watts, so 110V x 5A = 550W. Once you've determined the power rating, multiply that figure by how many hours that you expect it to operate during the day to figure out how much energy it will require. For instance 550W x 12 hours = 6600 watt hours, or 6600 / 1000 = 6.6 kWh per day. Do this with everything you intend to power, and add up the results for a total in kWh. |
Sizing A Solar PV Array
The next thing you'll need to know is the mean annual peak sun-hours that your location receives. Peak sun-hours is not the same as total daylight hours. Peak sun-hours refers to the amount of hours in a day that solar irradiance (the intensity of the sun) is at least 1000 watts per square meter or more. This is one of the factors in the standard test conditions (STC) that are used to help measure the power potential of a particular manufacturer's panel and establish its marketed power rating, so this needs to be considered when estimating how much power can be harnessed from your site. The amount of peak sun-hours will vary from day to day, and from season to season. On avg throughout the year, most regions in North America receive between 3-5 hours of peak sunlight each day. Exactly how much your region receives will depend not only on weather conditions, but specifically your latitudinal position. Areas that are further north or south of the equator will receive less sunlight compared to those located closer to the equator simply because they're angled further away from the sun.
|
So while your panels might technically receive 8-12 hrs of sunlight from sunrise to sunset on a given day, a fair estimate for actual peak sun-hours for most areas would be 4 hours per day. Using the 28.73 kWh per day energy demand from the example above, the total solar PV capacity required can be determined by dividing 28.73 kWh by 4 hrs = 7.2 kW of PV capacity. If you're looking to buy 300 watt panels from a local supplier, then you would need 7200 watt / 300 watt = 24 panels. Exactly what specifications your panels will have to meet in terms of voltage will depend on your battery bank voltage and type/size of your charge controller or power inverter (if grid tied).
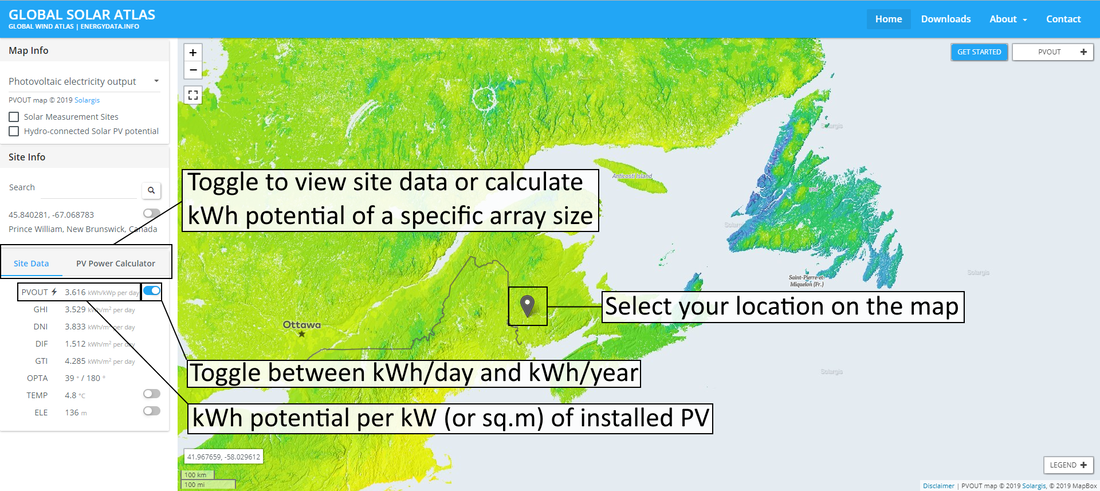
Another method to calculate PV capacity requirement would be to use an interactive solar insolation map like globalsolaratlas.info. After clicking on your location in the map, it will generate irradiance data for your area, and calculate how much energy in kWh that you can collect per kW of installed PV capacity (see the image on the right). |
Sizing A Wind Turbine
The sun doesn't always shine, however. Fortunately, the surface temperature differences that result from the sun's uneven heating of the planet is what generates wind. This is why spring and fall are usually considered the 'windy seasons' for most people, due to the temperature swings that come with the changing seasons. Wind and solar compliment each other well when incorporated together into a hybrid energy generating system, and helps to decrease reliance on backup gas and diesel generators.
The first step in sizing a wind turbine for your needs is determining how much wind energy is available in your area. This can be done by visiting the globalwindatlas.info/ wind atlas mentioned previously. Select your location and tower height, and the page should then display a couple of graphs that show the mean wind speed and mean power density in watts per square meter based on the frequency distribution of the wind. See the image below.
The first step in sizing a wind turbine for your needs is determining how much wind energy is available in your area. This can be done by visiting the globalwindatlas.info/ wind atlas mentioned previously. Select your location and tower height, and the page should then display a couple of graphs that show the mean wind speed and mean power density in watts per square meter based on the frequency distribution of the wind. See the image below.
Notice in the image above that the mean energy density is ~136 watts per square meter of swept area. Swept area refers to the total area that the blades on a turbine cover when they're spinning, and ultimately is what determines the amount of wind that a turbine can harness - it doesn't matter how efficient the generator itself is. Like a sail on a boat, the larger the swept area is, the more energy the turbine can harness. Swept area can be calculated by squaring the radius and then multiplying that by Pi. For example, a turbine with 1.83m (6 ft) blades will have a swept area of:
SA = (1.83 x 1.83) 3.1459
= 3.35 x 3.1459
= 10.5 square meters
SA = (1.83 x 1.83) 3.1459
= 3.35 x 3.1459
= 10.5 square meters
The total energy density of wind covering that amount of area will amount to 136 x 10.5 = 1428 watts. Unfortunately, it's physically impossible to extract all of the energy available in a wind stream. In perfect conditions, the highest percentage of energy that can be harnessed from the wind is 59.3%, known as the Betz limit coefficient. Even still, no turbine will perform that well for a number of reasons. A typical coefficient for most wind turbines would be somewhere between 25-40%. This factor depends on airfoil and blade design, turbine performance, air density, etc, and can really only be measured while a turbine is operating on site or in a wind tunnel. For estimation purposes, a coefficient of 30% will suffice. To determine the true energy density potential for a turbine with a 10.5 sq.m swept area operating at the location in the map above, simply multiply the total mean energy density by 30%: 1428 watts x 0.3 = 428.4 watts
So the true mean energy density available to a 10.5 sq.m turbine is ~428 watts, which translates to 40.8 watts per sq.m instead of 136 watts. To demonstrate how the Weibull distribution affects the mean annual output from a turbine at the mean annual wind speed, we can use the wind power equation to determine instantaneous power at the same instantaneous speed and compare the results:
P = 1/2ξpAV^3
where:
P = power in watts
p = density of the air in the wind stream in kg per cubic meter, typically 1.23 kg/m^3
A = rotor swept area in square meters = πr^2
V^3 = wind velocity at 4.7 meters per second cubed
ξ = turbine coefficient = 30% (0.3)
P = 1/2 [0.3 x 1.23 x 10.5 x (4.7 x 4.7 x 4.7)]
= 0.5 (0.3 x 1.23 x 10.5 x 103.82)
= 0.5 x 402.3
= 201.15 watts
So we can reasonably expect to see an instantaneous ~201 watts coming from the 10.5 sq.m turbine in a 4.7 sq.m wind stream. Now if we multiply that output by the Weibull parameter 2 (k), we can estimate the average output to be ~402 watts at the average wind speed of 4.7 mps. This is the difference between instantaneous power production at a given instantaneous wind speed at a given moment vs mean power production and mean wind speed over a period of time. When sizing your wind turbine, always base your calculations on the mean energy density and mean wind speed.
|
How do we determine what size turbine is needed, based on the electrical demand example from the electric bill above, and the wind data from the site location on the map? First we need to find the true monthly energy production per 1 sq.m of swept area. Do this by multiplying the total mean energy density of the wind at the mean wind speed by a typical turbine coefficient of 30%. Then multiply that result by 24 hours to get the daily total, and then by 30 days for the monthly total (remember that the Weibull distribution parameter accounts for variances):
136W x 30% = 40.8 watt per square meter true energy potential 40.8 x 24 hours = 979.2 watt hours, or 0.98 kWh per day 0.98 x 30 days = 29.4 kWh per month Now we just need to divide the total monthly energy demand from the electric bill, by the monthly energy production available from 1 sq.m of swept area to determine the size of turbine needed to meet the demand: 862 kWh demand / 29.4 kWh per month per sq.m = 29.3 sq.m So to meet the 862 kWh per month demand, a turbine with a 29.3 sq.m swept area is needed. In terms of blade length, that would be the square root of the result of 29.3 sq.m / Pi, which would be 3 meters, or 9 feet and 10 inches. If you want to make it really easy for yourself, you can visit Hugh Piggott's blog where he's graphed the potential annual kWh production for various size turbines within a common wind speed range. Keep in mind that his estimates are quite conservative, however. |
|
With all of this said, it's time to decide if you want 100% of your energy coming from renewables, 80%, 50%, etc. If you're planning on installing a full size off grid PV system, for example, then you really don't need a full size turbine. A turbine with half of the swept area required to fully power your home would suffice to compliment the solar, or vice versa. If you want to spare yourself the battery costs and install a grid tied system to help lower your monthly bill instead, then you have a bit more leeway. You could start with a 100 watt capacity if you wanted, and add to the system as your budget allows. It all boils down to your budget in the end. But this page should serve to help you figure out how to size your system to meet your needs without hiring an expert to figure it out for you, so that you're better informed if/when you do speak to a supplier or contractor about pricing. Most manufacturers will provide power curves and ratings, but they only tell part of the story about how their equipment will perform on your site. Some will provide an avg of what you can expect for monthly or annual kWh production from their equipment based on certain variables, but this is rare. So it's imperative to understand how to translate their numbers into useful estimates for your project, not just to size it properly but to also determine the best end cost per watt of installed capacity - this is what determines whether or not renewable energy is cheaper for you than purchasing from the grid, ie: your net return in energy cost savings.


